Leaflet + D3
This is a demonstration of using Leaflet and D3 together.
We start with a D3 visualisation which shows the pubs in the UK city of Cambridge in the style of the London Underground map.
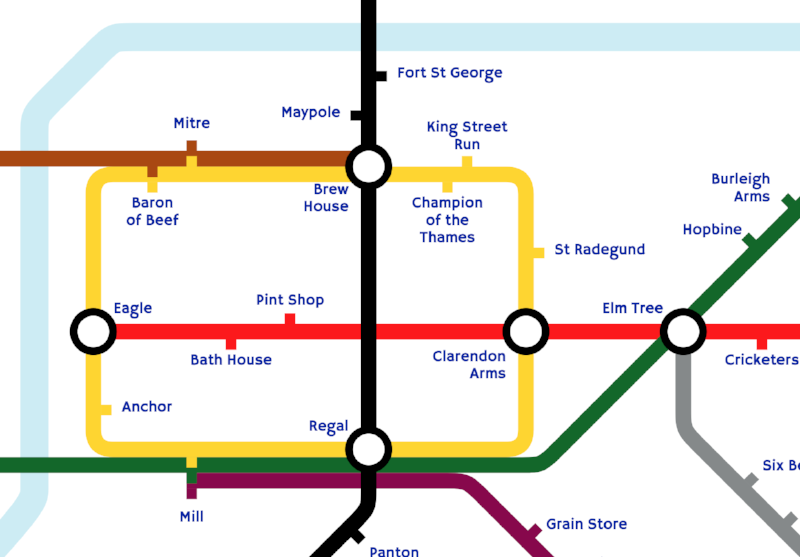
This is basically a map. While not being geographically accurate I would like for users to interact with it as they would with any other online map. An experience similar to Google Maps would do nicely.
We can get close using d3-zoom. You can see the result here. The user can now pan and zoom. It's good but, for me, I really miss the inertial scrolling you get with Google Maps. This means when you drag the map and let go, the map takes a while to stop moving. It's a surprisingly ergonomic effect.
Where should we turn? There are many mapping libraries available to us which provide the features we want out of the box. I've used Leaflet before and been pleasantly surprised by how easy it is to get up and running. Can we combine it with D3?
There are a few examples out in the wild.
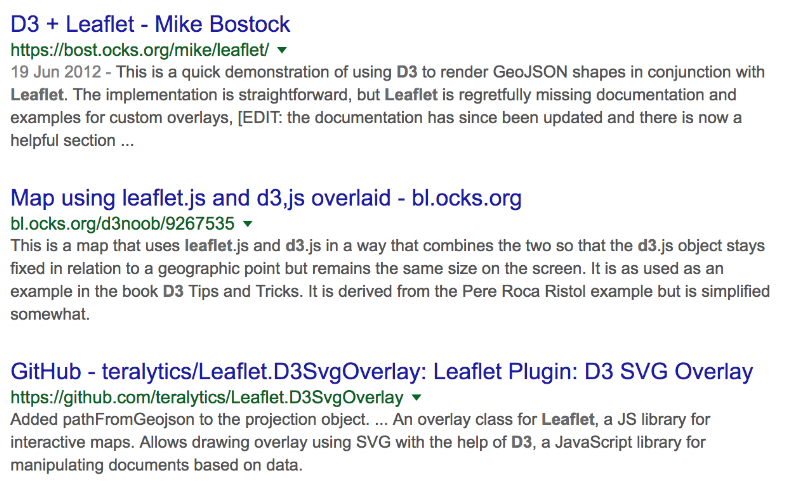
D3 + Leaflet by Mike Bostock is a quick demonstration of using D3 to render GeoJSON shapes in conjunction with Leaflet. All these examples effectively reach inside the Leaflet map and let you use D3 to draw into a new map layer.
There's nothing wrong with this approach but it feels like we're working against Leaflet rather than with it. Now, my visualization is static. This means that once we've used to D3 to render the SVG we really don't make use of D3 anymore. If we combine this observation with the support for ImageOverlays in Leaflet we can ask, "If I convert my D3 visualization to an SVG image and pass that to Leaflet will everything just work?"
It does! You can see the result here.
As usual there are trade-offs involved with this approach. The SVG is embedded as an <img> element. This means:
- You cannot manipulate the image with JavaScript
- If you want to control the SVG content with CSS, you must include inline CSS styles in your SVG code. (External stylesheets invoked from the SVG file take no effect)
- You cannot restyle the image with CSS pseudoclasses (like :focus)
- But we want our map to be interactive. For example, clicking on a 'station' should do something. This is where we start adding complication to our solution.
Leaflet supports adding interactive markers and shapes to a map. As a proof of concept, we extract the bounding boxes of the labels and use these to draw a set of rectangles.
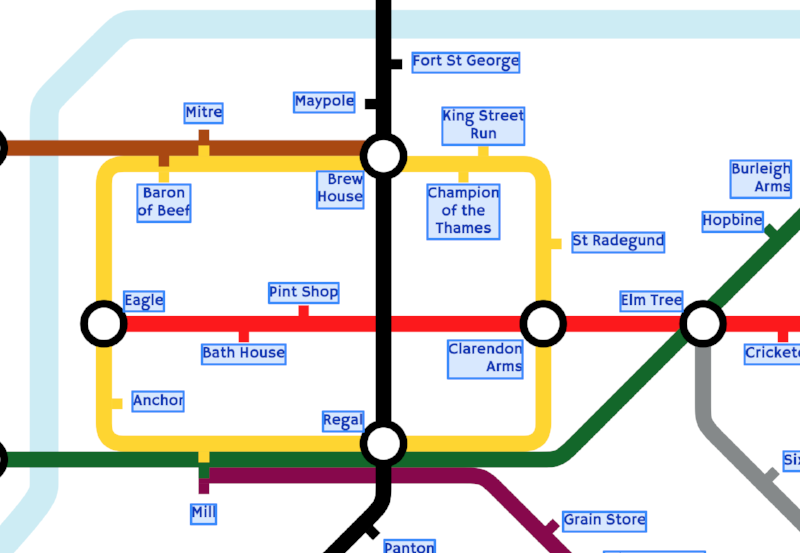
Looking good! We can set the opacity of these rectangles to zero and we have our interactivity back.
Let's recap. Our solution works as follows:
- generate SVG file offline
- generate bounding box data for the labels offline
- add SVG as an ImageOverlay in Leaflet
- draw transparent rectangles using bounding box data
If you're interested in the technical details and one surprising gotcha and workaround then read on, otherwise thank you for taking the time to read this post.
Generating an SVG offline
I'm already using JSDOM as part of my tests. We can reuse it to get at the SVG elements that make up our visualization. This means we can do this from the command-line and not involve a browser.
var jsdom = require('jsdom');
var fs = require('fs');
var path = require('path');
var d3 = Object.assign({}, require('d3-selection'), require('../'));

var dom = new jsdom.JSDOM('<!DOCTYPE html><div></div>');
var bodyActual = dom.window.document.body;

global.SVGElement = function() {};

var data = JSON.parse(
  fs.readFileSync(path.join(__dirname, '../example/pubs.json'), 'utf8')
);

var width = 1600;
var height = 1000;

d3
  .select(dom.window.document.body)
  .select('div')
  .datum(data)
  .call(
    d3
      .tubeMap()
      .width(width)
      .height(height)
      .margin({
        top: 20,
        right: 20,
        bottom: 40,
        left: 100,
      })
  );

var pretext = `<?xml version="1.0" encoding="utf-8"?><!DOCTYPE svg PUBLIC "-//W3C//DTD SVG 1.1//EN" "http://www.w3.org/Graphics/SVG/1.1/DTD/svg11.dtd"> <svg version="1.1" xmlns="http://www.w3.org/2000/svg" xmlns:xlink="http://www.w3.org/1999/xlink" x="0px" y="0px" width="${width}px" height="${height}px" viewBox="0 0 ${width} ${height}" enable-background="new 0 0 ${width} ${height}" xml:space="preserve"><defs><style type="text/css"><![CDATA[
@font-face {
font-family: 'Hammersmith One';
src: url(data:application/font-woff2;charset=utf-8;base64,d09GMgABAAAAAFy8ABEAAAAA0lQAAFxUAAEAgwAAAAAAAAAAAAAAAA...
url(data:application/font-woff;charset=utf-8;base64,d09GRgABAAAAAHOMABEAAAAA0mgAAQAAAAAAAAAAAAAAAAAA...
font-weight: normal;
font-style: normal;
}
text {
font-family: "Hammersmith One", Arial;
fill: rgb(0, 25, 168);
font-size: 52px;
cursor: pointer;
font-weight: 400;
}]]></style></defs>`;
var svg = dom.window.document.querySelector('svg').innerHTML;
var posttext = `</svg>`;

fs.writeFile('./cambridge-pub-map.svg', pretext + svg + posttext, function() {
  console.log('Scccessfully wrote file to ./cambridge-pub-map.svg');
});

function file(file) {
  return fs
    .readFileSync(path.join(__dirname, file), 'utf8')
    .replace(/\n\s*/gm, '');
}
You can see we're adding some preamble to the file to make it a valid SVG document. We're also embedding a stylesheet into the file.
The code can be found here: https://github.com/johnwalley/d3-tube-map/blob/master/util/create-svg.js.
Generating bounding box data offline
Using JSDOM won't work here as it does not perform any layout. I'd made a note to myself to check out Puppeteer at some point and this was the perfect opportunity. Puppeteer is a Node library which provides a high-level API to control headless Chrome.
const fs = require('fs');
const puppeteer = require('puppeteer');

(async () => {
  var content = fs.readFileSync('cambridge-pub-map.svg', 'utf-8');
  var json = JSON.parse(fs.readFileSync('./example/pubs.json', 'utf-8'));

  const browser = await puppeteer.launch();
  const page = await browser.newPage();
  await page.setContent(content);

  const metadata = await page.evaluate(() => {
    const text = [...document.querySelectorAll('text')];
    return text.map(t => ({
      name: t.parentElement.id,
      x: t.getBBox().x,
      y: t.getBBox().y,
      width: t.getBBox().width,
      height: t.getBBox().height,
    }));
  });

  fs.writeFile(
    './cambridge-pub-map.json',
    JSON.stringify(
      metadata.map(x => ({
        ...x,
        label: json.stations[x.name].name,
      }))
    ),
    function() {
      console.log('Scccessfully wrote file to ./cambridge-pub-map.json');
    }
  );

  await browser.close();
})();
I was blown away with how easy this was to put together. A big thumbs up to Puppeteer's getting started experience.
The code can be found here: https://github.com/johnwalley/d3-tube-map/blob/master/util/create-metadata.js.
Web fonts and SVG Images
There had to be one show-stopping, unexpected problem and this is it. The visualization uses a web font, Hammersmith One, to recreate the look of the London Underground map that inspired it. This is fine if you are using D3 as it typically is used, to manipulate the DOM. An SVG element inlined in the DOM can use external web fonts. A standalone SVG file opened in a web browser can use external web fonts. A standalone SVG file referenced in a <img> element cannot use external web fonts.
This took a while to track down and this Stack Overflow answer was helpful and describes the solution I ended up using. We can embed the font using a data uri.
@font-face {
font-family: 'Hammersmith One';
src: url(data:application/font-woff2;charset=utf-8;base64,d09GMgABAAAAAFy8ABEAAAAA0lQAAFxUAAEAgwAAAAAAAAAAAAAAAA...),
url(data:application/font-woff;charset=utf-8;base64,d09GRgABAAAAAHOMABEAAAAA0mgAAQAAAAAAAAAAAAAAAAAA...),
font-weight: normal;
font-style: normal;
}
I used Font Squirrel to generate the base64 encoding for the embedding. Obviously, this bloats the SVG file considerably but is an acceptable solution for this particular problem.