Reusable charts
When it comes to creating visualizations on the web D3 is often your first port of call. Whether by putting together a custom creation from scratch, or making use of one of the many charting libraries and examples available.
The former, creating visualizations myself using the low-level functionality provided by D3, is my area of interest. In particular I'm interested in doing this over-and-over again. As with any other type of software development I'm involved with, I'm looking to make a trade-off between creating abstractions and designing for reuse on one-hand, and KISS and YAGNI on the other-hand.
Past experience
Last year I put together a visualization of rowing races which take place in Cambridge in the UK.
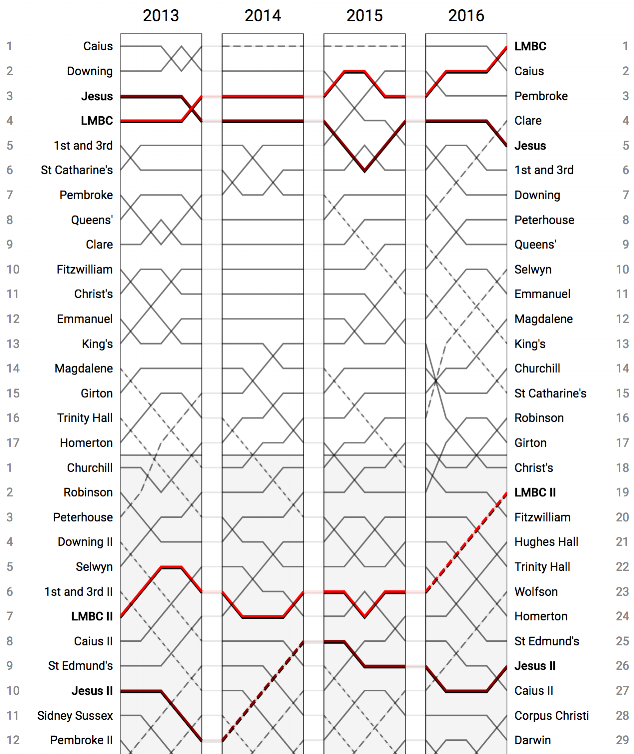
You can see the finished result here. The code for the chart itself is available here.
The interface is fairly minimal. A chart object is provided with two methods: setup and render.
function chart() {};

chart.setup = function(el) {...};
chart.render = function(props) {...};
The setup function takes a DOM element and performs as much setup as possible without any data. This is typically creating elements we know we will need such as the top-level svg container and svg group elements.
To draw the cart you call the render method. This takes a props object which contains the data to draw as well as any callbacks you want to provide. In this case the user can select chart elements which the larger application needs to act on.
The same method should also be used for any updates to the chart. Internally I use d3's enter, update, exit pattern to smoothly transition between different data.
I learned a lot about what challenges you face developing a reusable chart through putting this together. In particular I've written up some of my thoughts on making d3 work with React.
Towards reusable charts
Before diving into more details let's take a step back. The term reusable charts in the context of d3 seems to have gained popularity starting with a 2012 post by d3's creator, Mike Bostock. Towards Reusable Charts is very much a starting point for discussion. However its influence can clearly be seen in other discussions on the topic. For example:
A chart is implemented as a closure with getters and setters.
function chart() {
  var width = 720, // default width
    height = 80 // default height

  function my() {
    // generate chart here, using `width` and `height`
  }

  my.width = function (value) {
    if (!arguments.length) return width
    width = value
    return my
  }

  my.height = function (value) {
    if (!arguments.length) return height
    height = value
    return my
  }

  return my
}
We're still missing any reference to a DOM element to render into as well as any data. Mike's suggestion is to use the presentation of elements and data that D3 already provides: a selection. The key takeaway is that a selection represents DOM elements and associated data.
Once you've created both a selection and an instance of the chart object you can then combine the two.
myChart(selection)
or
selection.call(myChart)
The chart implementation now takes a selection and becomes a little more complicated.
function my(selection) {
  selection.each(function (d, i) {
    // generate chart here; `d` is the data
    // and `this` is the element
  })
}
A full example can be found here: https://bost.ocks.org/mike/chart/time-series-chart.js.
While this is idiomatic D3 and consistent with much of the rest of the library; it does feel somewhat obscure. There are parts of the D3 API which are conceptually difficult. I don't think its creator would disagree too strongly either. See What Makes Software Good?. A fair question to ask here is whether you want your chart to expose the fact it uses D3 to the outside world?
Right, let's take a look at how some of the more popular D3-based charting libraries tackle this problem!
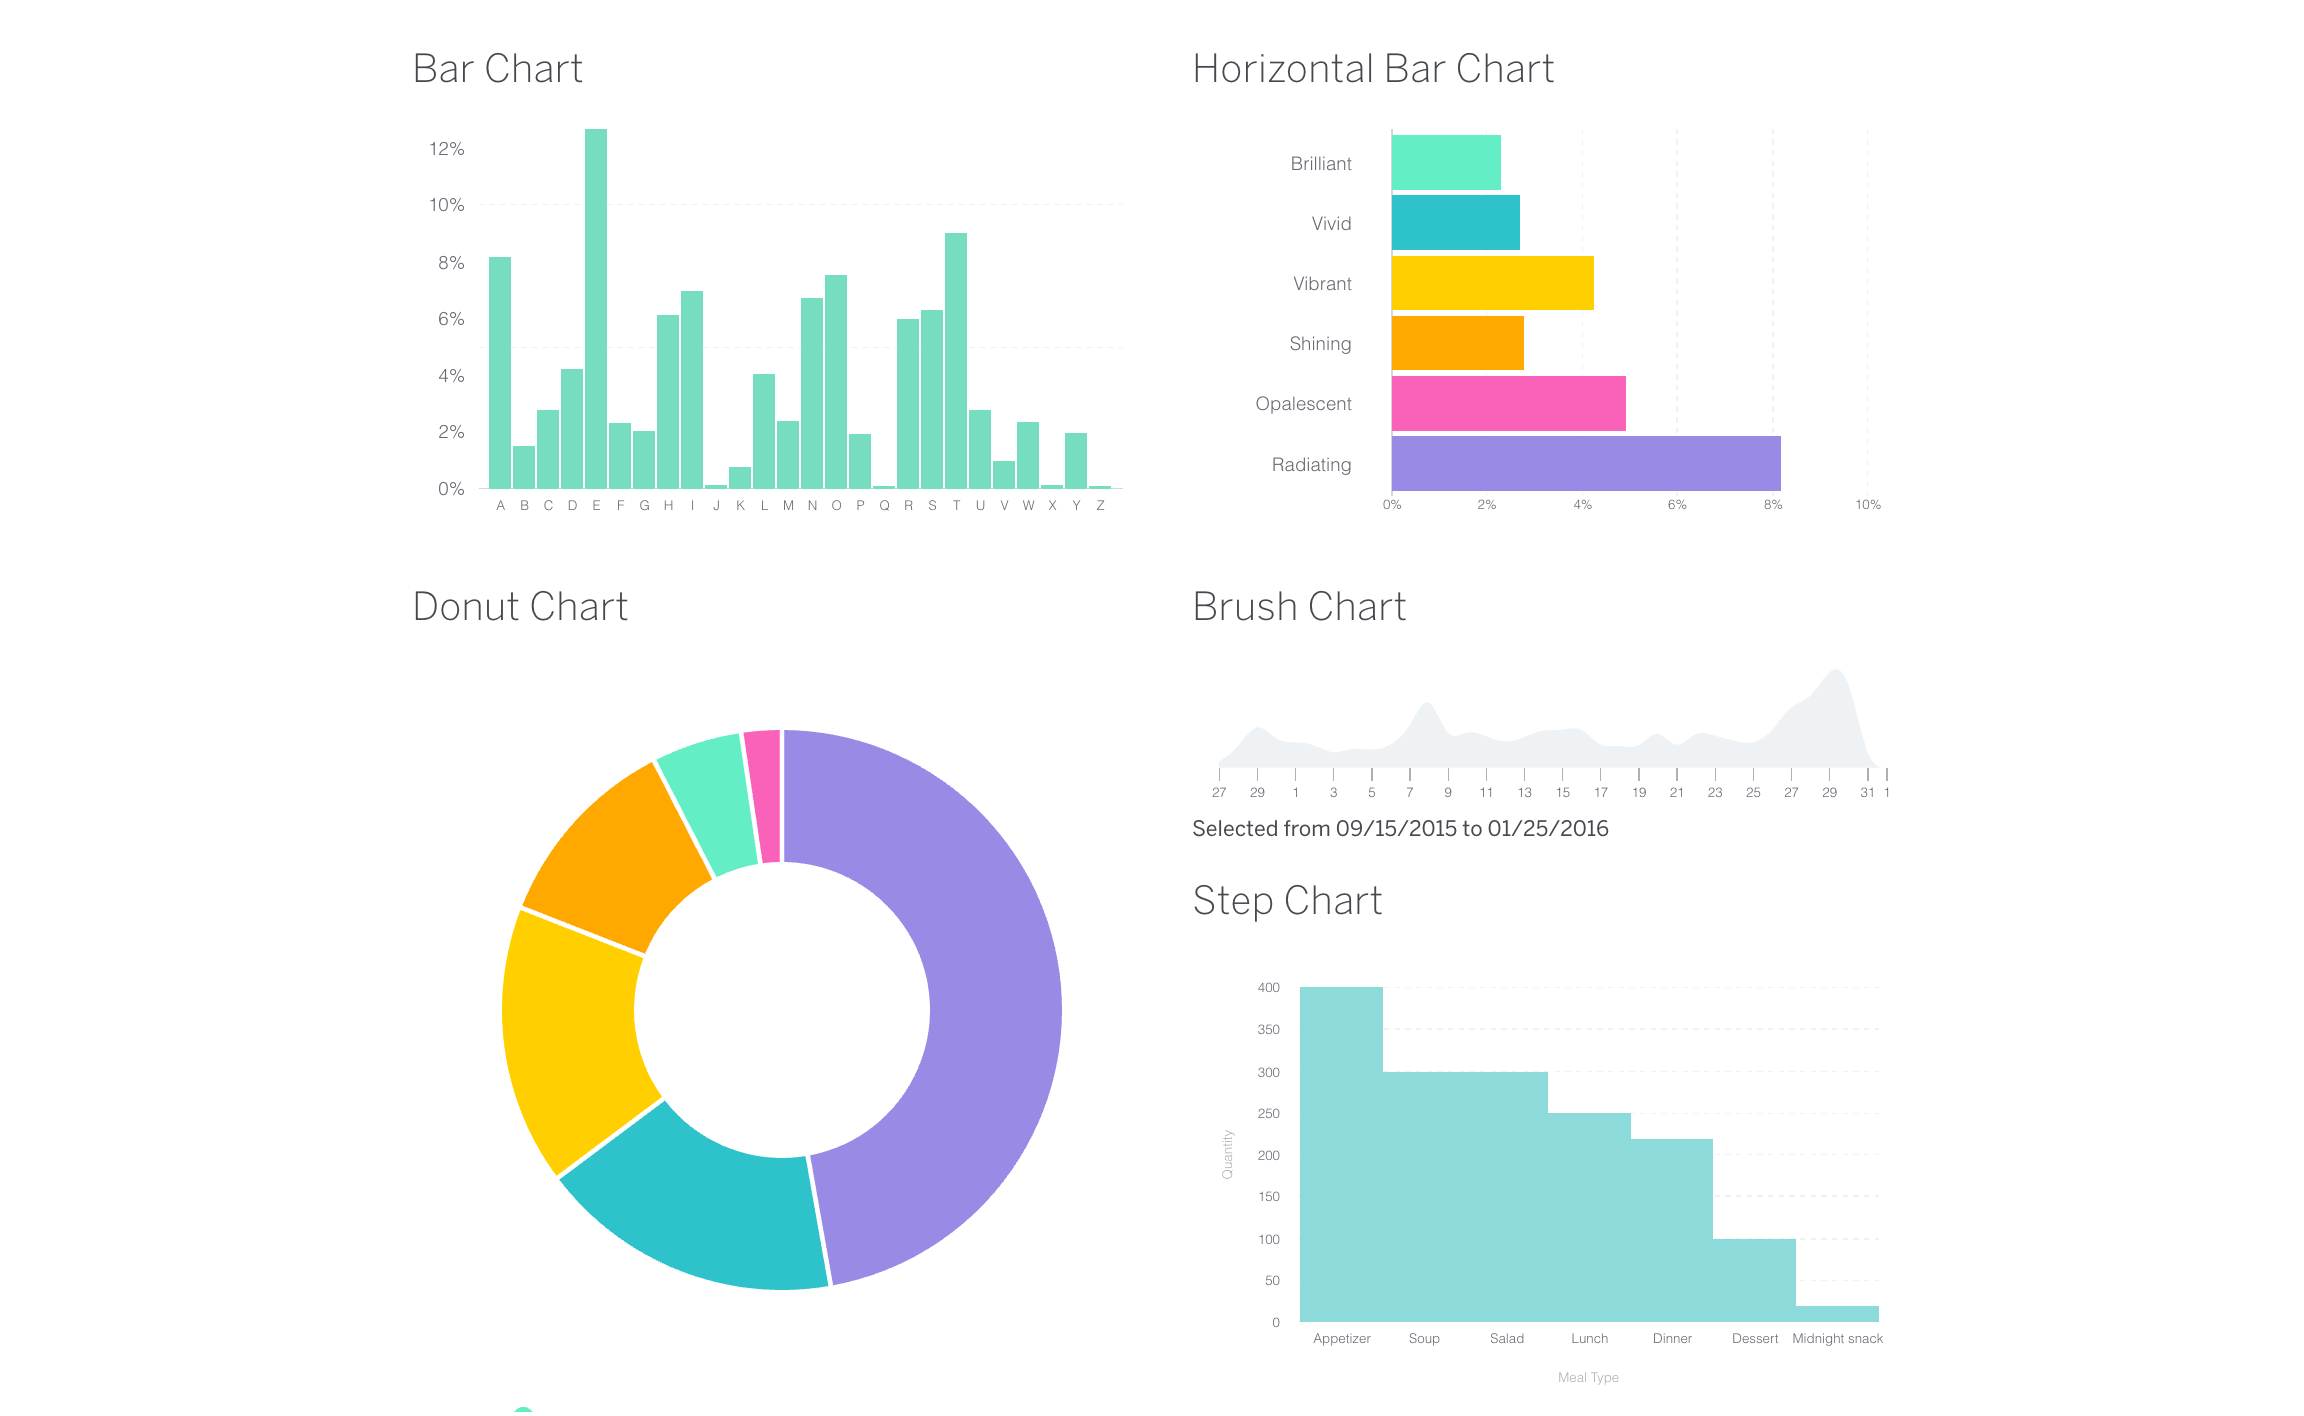
Britecharts
Released in 2017, Britecharts describes itself as "a client-side reusable Charting Library based on D3.js v4 that allows an easy and intuitive use of charts and components that can be composed, creating beautiful visualizations."
Reusable is right there in the description so let's take a look at what your calling code would look like.
barChart.width(500).height(300)

barContainer.datum(dataset).call(barChart)
So far, so familiar. Let's take a look at the implementation of a bar chart.
return function module() {
  let margin = {
    top: 20,
    right: 20,
    bottom: 30,
    left: 40
  },
  width = 960,
  height = 500,
  data,
  dataZeroed,

  function exports(_selection){
    _selection.each(function(_data){
      chartWidth = width - margin.left - margin.right - (yAxisPaddingBetweenChart * 1.2);
      chartHeight = height - margin.top - margin.bottom;
      ({data, dataZeroed} = cleanData(_data));

      buildScales();
      buildAxis();
      buildSVG(this);
      drawGridLines();
      drawBars();
      drawAxis();
    });
  }
}
There's quite a lot going on (note that this uses ES2015) but you should see that this is exactly the same implementation as described in Mike Bostock's 2012 post.
C3.js
C3.js styles itself as a "D3-based reusable chart library". There's that word again!
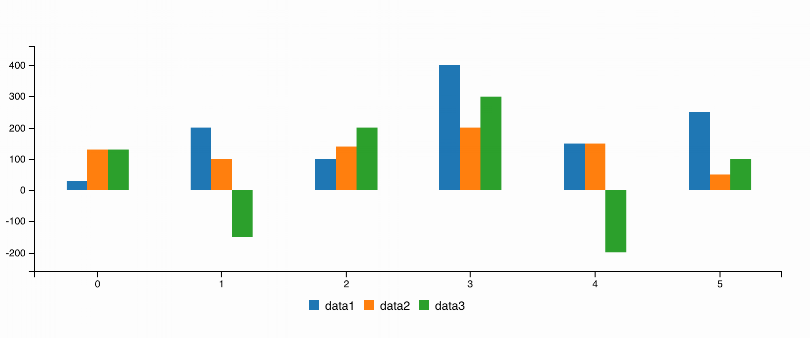
Calling code looks like this
var chart = c3.generate({
  bindto: '#chart',
  data: {
    columns: [
      ['data1', 30, 200, 100, 400, 150, 250],
      ['data2', 50, 20, 10, 40, 15, 25],
    ],
  },
})
Ah ha. This is a very different approach. Much more declarative. Let's dig into the implementation
c3.generate = function (config) {
  return new Chart(config)
}
The generate function takes a config object and returns a new instance of a Chart object. The element the chart should bind to is used internally to create a D3 selection.
$$.selectChart = d3.select(config.bindto)
I'm not familair with the C3.js codebase but after some digging about it looks like internally a transformed version of the data is bound to a D3 selection, for example:
$$.mainBar = $$.main
  .selectAll('.' + CLASS.bars)
  .selectAll('.' + CLASS.bar)
  .data(barData)
Ultimately both C3.js and Britecharts use D3 in the same way. However they present two very different interfaces. C3.js is declarative whereas Britecharts is more imperative. This almost leads into the way that C3.js does not immediately leak out the fact it uses D3. Britecharts at the very least requires you to know what a D3 selection is.
Summary
This has been a whistle-stop look at the problem of reusable charts in D3. We've taken a look at solutions as implemented by two real-world charting libraries.
Two topics I've not touched on in this post are styling and interactivity. Both pose particular challenges for encapsulation. Look out for future posts on these topics!