Update: Women's Eights Head of the River Race winning times
My last post looked at the winning times for one of the world's largest rowing races. We saw that the results were very variable but I wasn't sure what the important factors might be.
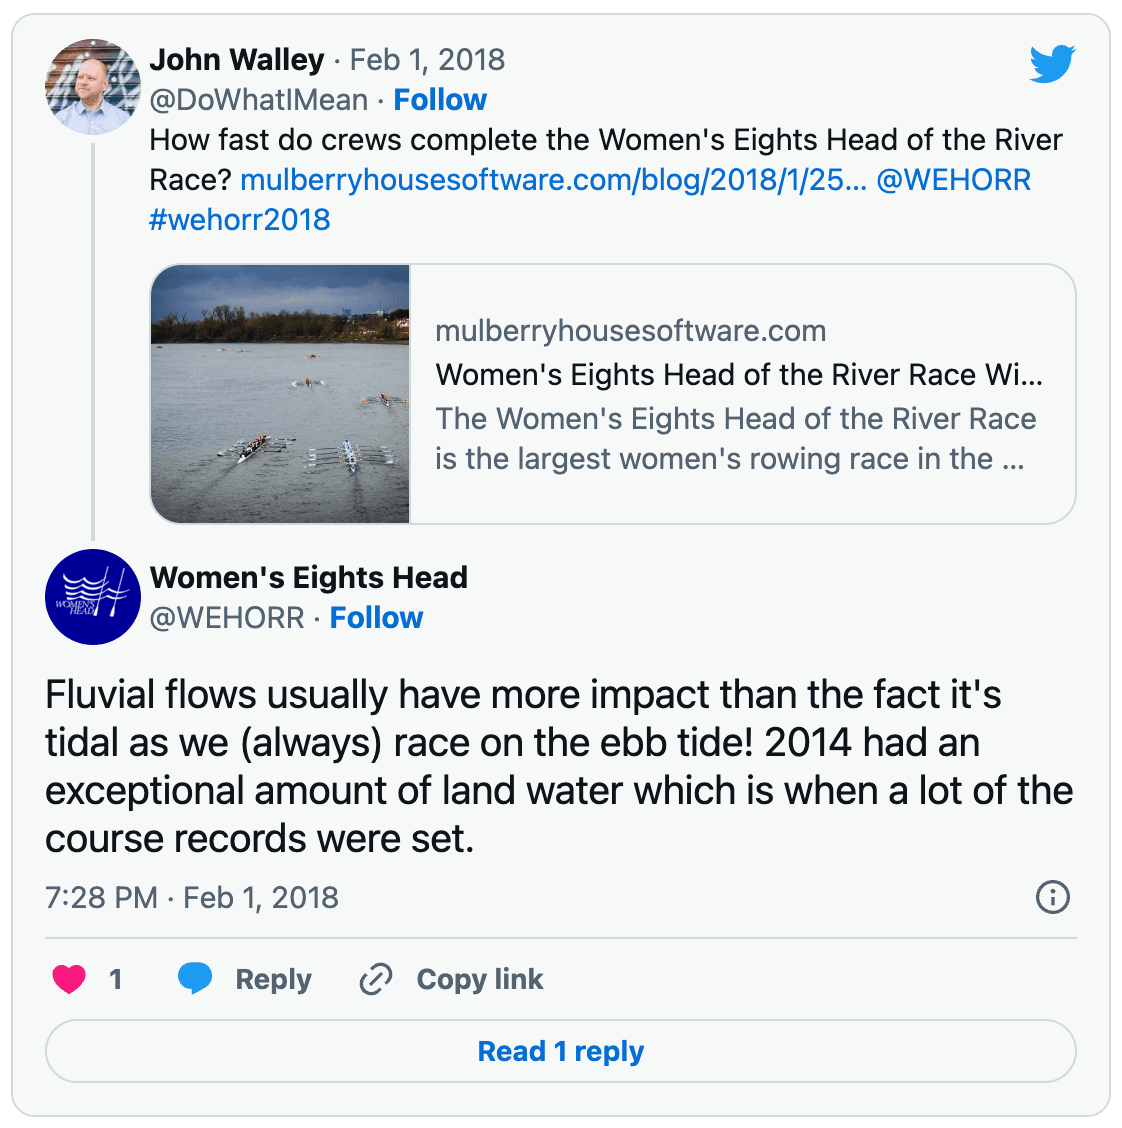
The organisers were kind enough to point me in the direction of an important variable: fluvial flow.
I've taken the flow rate from the National River Flow Archive. The data comes from measurements taken at Teddington lock a few miles upstream. The average flow rate for each race day is shown below as the orange bars. The dots still represent the winning time.
No clear trend stands out. The course record, set in 2014, did take place with a high flow. However, there were two other years with even higher flow.
A scatter plot of winning time versus flow will help us tease out any relationship.
The line of best fit suggests that there is a correlation between the two variables. Faster flow is associated with lower winning times. That said, it's a weak correlation. A simple statistical measure, R-squared, gives us a value of 0.2. This suggests that if there is a correlation then the flow will only account for a small proportion of the variability we see in winning times.
But we shouldn't be surprised by this. Remember, it's a different crew winning each year. The difference between crews year-to-year could well be the biggest variable of all!