Resuable charts and extensible frameworks
A few months ago, I wrote about reusable charts. The thinking behind the blog post fed into the initial design for a new web application - Financial Canvas Studio. It helps professionals in the pension industry understand their financial models and the assumptions that go into them - leading to smarter decisions.
At its heart, the application presents the user with a dashboard made up of a number of charts. The design is summarised in the diagram below.
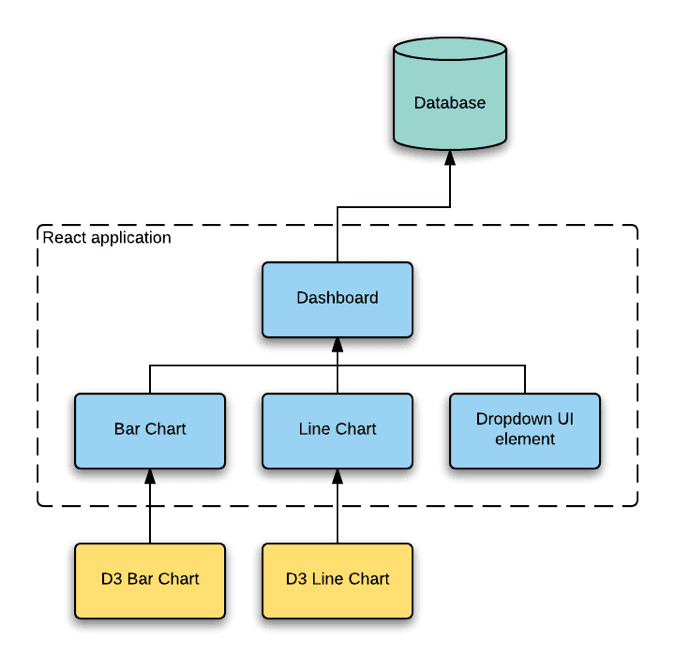
The application is built using React but that's not the topic of this post. What is of interest is that each chart is made up a React component which then calls the underlying d3 chart implementation. This is important because both React and d3 want to control your application UI. It's best to box one or the other off.
So, what does this have to do with reuse and extensibility? Well, we're going to look at three examples which illustrate the concepts.
- the reusable charts developed specifically for this application
- dropping in a set of third-party charts which share the same API as our own charts
- doing away with the explicit use of d3 and substituting a React charting library
Reusable charts developed specifically for this application
All things considered we've been happy with the interface we settled on for our charts.
For example, we make our React components aware of their width and height using React Sizeme. Because our charts are required to expose a width and height property we can make all our charts responsive with just a few lines of code.
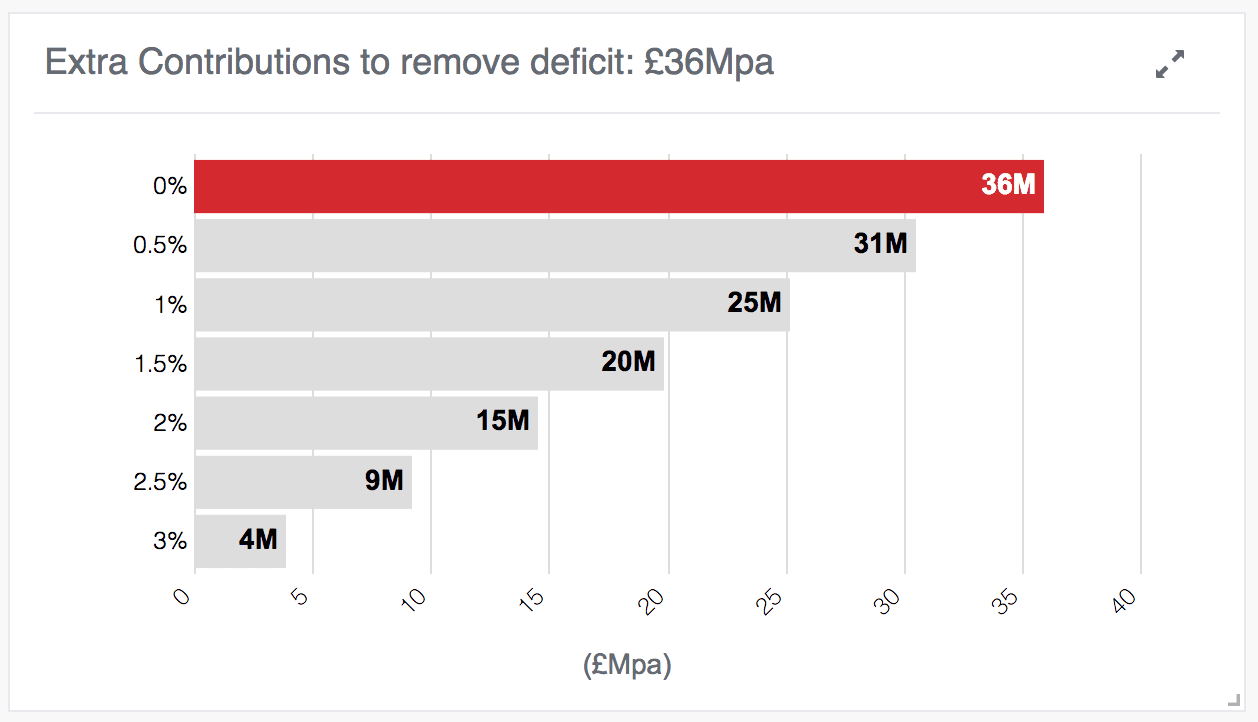
The best example of reusability was as part of implementing full-screen charts. This is the simply ability to maximise a chart so you can really focus on it.
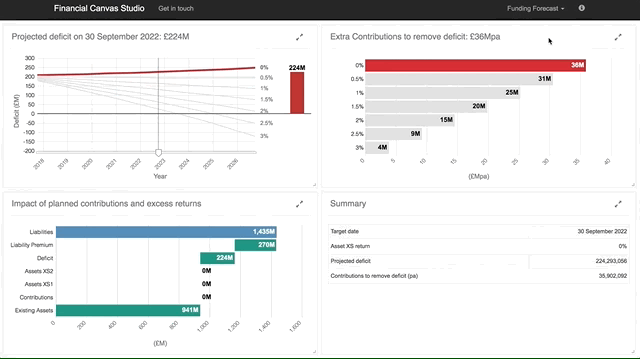
On a technical level, we pop up a modal and draw a brand new chart into it. This worked flawlessly for the most part. In fact, it helped us discover which elements were not playing nicely when the charts were reused in a different context. In particular, elements such as tooltips were effectively implemented assuming access to global state. Once we'd identified these issues they were easy to fix.
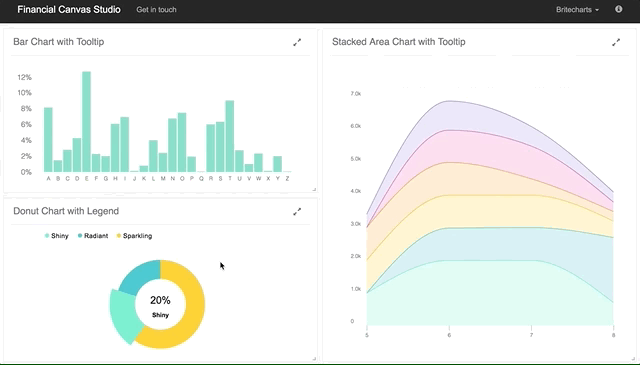
Third-party charts
The chart interface we settled on is for all practical purposes identical to that used by Britecharts.
This isn't a coincidence. This approach is common in the d3 community. It traces its heritage back to the many hundreds of examples Mike Bostock, d3 creator, has produced online.
What it does mean is that we should be able to include a selection of charts from Britecharts in exactly the same way as our existing charts.
In practice, this was mostly true. Most of the speed-bumps I hit were to do with the semantics rather than the syntax of the interfaces. Concepts such as width, height and data were identical. However, whether the chart should animate when it is redrawn is a more nuanced concept. For example, when resizing a chart, you want it to be fluid and responsive so disabling animation is a must. Thankfully both sets of charts expose a method of disabling animation but we do so in different ways.
It's this type of more involved questions which make for a successful implementation above and beyond simply exposing a correct API. Prototyping the integration with Britecharts has been illuminating because it shows up areas where I've made design decisions but not been explicit about them. In a similar vein. Having a colleague implement a few charts using the API I designed has also forced me to go back and document, and sometimes change, aspects which only existed in my own head.
Doing away with D3
We've got a React application. Using a React-specific chart library should be straightforward? Step forward vx.
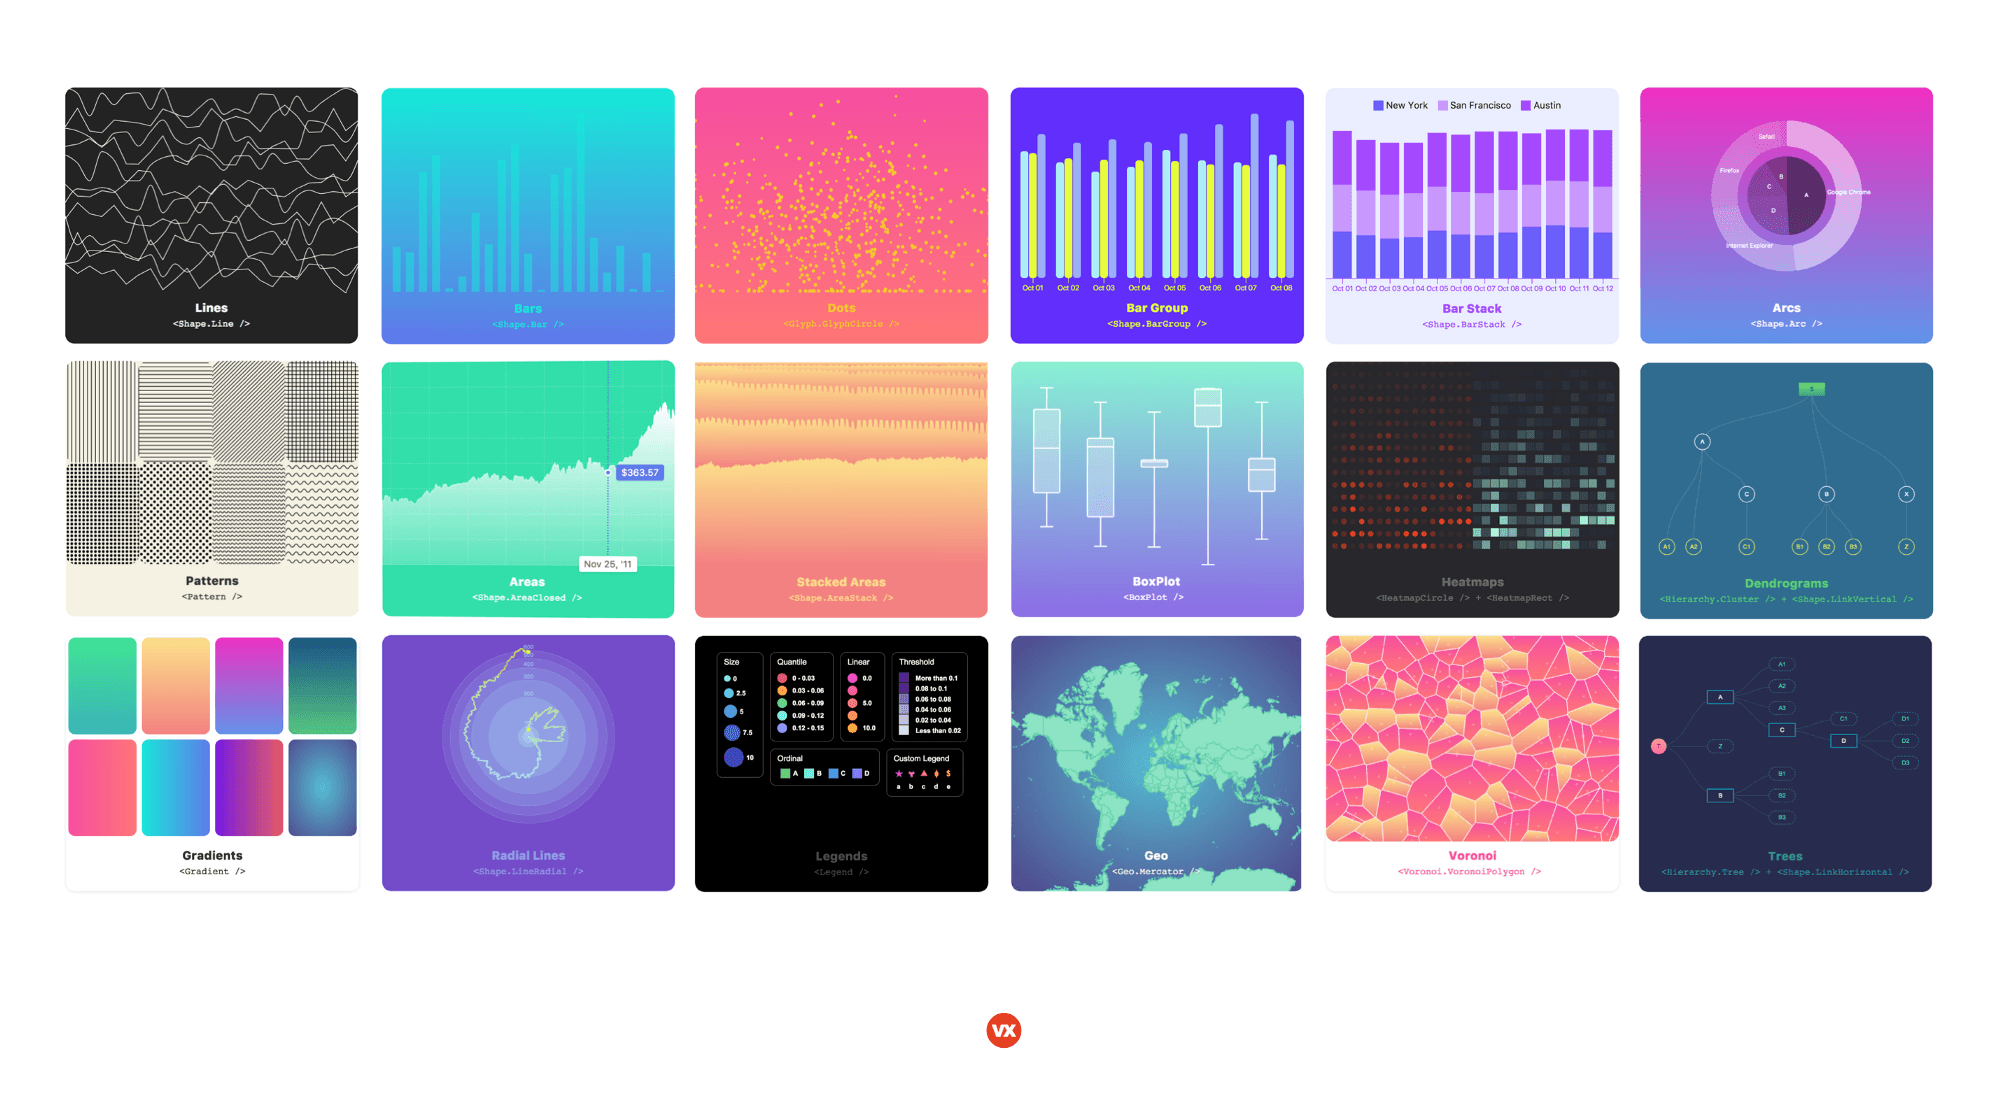
vx is still in beta - no support for interactivity yet for example - but can certainly generate some striking charts. The eagle-eyed among you may have spotted that vx uses d3 under the hood. For our purposes, what's important about vx is that it exposes a purely React-based interface. If anything, this shows how ubiquitous d3 has become.
Dropping in the necessary React components was straightforward and the results look great!
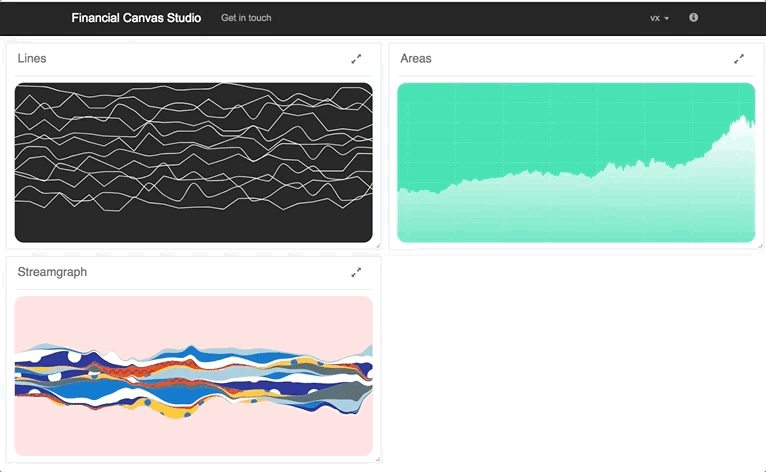
The work to integrate vx's React charts into our application was actually easier than with Britecharts. If I had to put my finger on the main reason it would be that Britecharts is very similar but subtly different. This results in many small annoyances. Whereas vs is something completely different to the existing charts. It also helps that vx is a set of React components being used within a React application.
Final thoughts
Designing software for reuse and extensibility is about trade-offs. The allure of YAGNI (You Aren't Going To Use It) is strong. This isn't a post about how to make the right decisions about how flexible to make your application. What it is is a demonstration of how actually reusing functionality and really attempting to extend your codebase is more illuminating than untested theoretical architectural musings.
Of course, what you really want are real users and developers reusing and extending you application, framework or code. That's the best way to learn of all.